

Trading Series: Markets and Strategies Explained
📈 Explore trading basics, market types, tools, strategies, risk control & psychology focused for South African traders to boost confidence and skills.
Edited By
Sophie Bennett
Boom and crash trading has become a popular approach for traders looking to capitalise on volatile market reactions. Unlike traditional forex or stock markets, these indices simulate price spikes and drops, offering exciting opportunities — but they also bring unique risks that can catch sellers off guard.
Understanding how boom and crash indices behave is fundamental. The 'boom' market typically features sudden upward price surges, followed by gradual declines, while the 'crash' market sees abrupt price drops, then slow rallies. This clear, repeated pattern gives traders a chance to time their entry and exit points with precision.
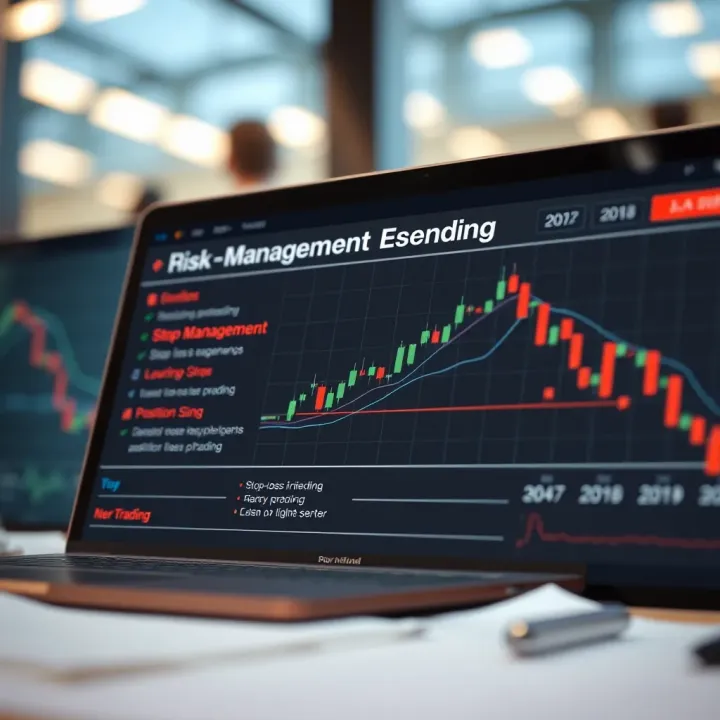
Successful trading here requires more than guesswork — it demands well-thought-out strategies, discipline around risk, and using tools that suit your trading style.
For South African traders, boom and crash markets offer a practical avenue amid local challenges like loadshedding and data costs. Since these indices run continuously without traditional market closures, you can enter positions when it suits your schedule, even during griping power cuts.
Predictable Spikes: Boom markets experience sharp climbs roughly every 30–50 bars, while crash markets drop steeply on a similar interval.
Low Point Values: These indices often start around price points like 500 (crash) or 1000 (boom), facilitating smaller trades and faster turnover.
Leverage Use: Many brokers offer leverage with these instruments, amplifying gains but also risks, so managing leverage carefully is essential.
Imagine you spot a boom index price steadily rising but not yet spiking. A trader might place a sell trade just before the anticipated spike, expecting an immediate sharp drop. If timed correctly, this can net quick profits. However, if the market runs longer than expected, losses can mount fast, emphasising the need for stop-loss setup and swift trade management.
Understanding these basics sets a solid foundation before digging into specific methods and risk management techniques. Next sections will guide you through actionable tactics and how to tailor them for consistent results in the South African trading environment.
Grasping how boom and crash markets work is fundamental for anyone serious about trading these instruments. These markets differ markedly from traditional shares or forex, so jumping in without understanding can be like trying to drive a bakkie blindfolded – not advisable at all. Knowing the mechanics helps traders develop strategies that reflect the unique price patterns and risks of boom and crash indices.
Boom and crash indices are synthetic instruments usually offered by online brokers, designed to simulate rapid price movements in a controlled environment. A boom index typically shows sudden sharp upward spikes followed by more gradual declines, while a crash index features sudden steep drops with slower recoveries. Both indices aim to capture short bursts of volatility, letting traders capitalise on quick moves rather than long-term trends.
Unlike stocks or forex, which are influenced by tangible economic data and company performance, boom and crash indices are algorithm-driven. This means they often follow programmed price behaviours, making them somewhat predictable if you understand their rhythm. For example, a crash 500 index might have a 'crash' event roughly once every few hundred ticks, creating an opportunity window for well-timed trades.
Price behaviour during trading sessions on these indices often involves sudden jumps or drops – the booms and crashes – followed by sideways trends or minor retracements. These sharp moves typically don’t last long but can offer a solid profit if the timing is right. It's common to see a boom index jump by several points in moments, then soften gradually, giving traders an entry and exit rhythm to work with.
Volatility plays a major role here. The spreads on boom and crash indices are usually kept tight, but the fast price spikes mean that risk can ramp up quickly. Traders should pay attention to the timing of these spikes, often influenced by market hours and broker-specific algorithms. For example, during South African trading hours, local liquidity can affect execution and slippage, especially if you're trading through a platform based overseas.
Understanding these patterns allows you to position yourself smartly, avoiding the pitfalls of chasing price spikes blindly. Knowing when to expect these sharp moves can make the difference between a strong win and a costly loss.
In short, mastering the unique price dynamics and characteristics of boom and crash indices equips you with the right mindset and tools to trade confidently and effectively in these volatile markets.
Understanding core strategies is essential for gaining an edge in boom and crash trading. These markets can move quickly, often with sharp spikes or drops, so having a clear approach helps navigate volatility and seize opportunities. This section breaks down fundamental tactics you can apply immediately, focusing on practical benefits like timing entries and exits and adapting to market behaviour.
Trend following is about riding the market's direction rather than fighting it. If prices keep rising steadily, a trend follower buys with the expectation the uptrend continues; if prices drop, they sell or stay out. In boom and crash trading, trends often appear in waves with sudden surges (booms) or dips (crashes) that last long enough to capture profits. For example, if the boom index shows a consistent upward push over several candles, entering a buy position early can lock in gains before a reversal. This strategy suits traders who prefer steady growth and are patient enough to wait for confirmation rather than jumping in and out rapidly.

By contrast, the reversal strategy targets points where the price changes direction—buying at the dip or selling at the peak. Because boom and crash indices often show sharp spikes followed by quick reversals, spotting when the current move is exhausted can be profitable. For instance, if the crash index suddenly falls sharply but shows signs of slowing momentum or support forming, a trader might open a buy position anticipating a bounce. This approach requires sharper timing and using confirmation signals like candlestick patterns or volume changes to avoid traps.
Certain technical indicators help make sense of boom and crash price behaviour. The Relative Strength Index (RSI) is useful for spotting overbought or oversold conditions, signalling potential reversals. Moving averages, especially the 50- and 200-period, give clarity on trend direction and areas of support or resistance. For example, if the boom index price crosses above the 50-period moving average, it often marks the start of an upward move. Combining these indicators can reduce guesswork and help objectively decide when to enter or exit trades.
Several patterns offer clues about future price moves in boom and crash indices. Double tops or bottoms indicate likely reversals, while flags and pennants suggest continuation of the trend. For example, a double bottom on the crash index chart following a steep fall could signal the selling pressure is easing, offering a buying chance. Being able to recognise these patterns quickly helps avoid getting caught on the wrong side of a volatile move.
Focusing on these core strategies builds a foundation to trade boom and crash indices methodically and avoid impulsive mistakes. Combine trend following and reversal techniques with tailored indicators and chart patterns to match your risk comfort and trading style.
Managing risk is vital when trading boom and crash indices due to their unique, often volatile price swings. Without a solid risk management plan, traders expose themselves to sudden losses that can quickly wipe out capital. Taking steps to control risk means protecting your trading account from sharp, unexpected moves and managing exposure carefully.
Stop losses are your first line of defence against heavy losses. In boom and crash markets, placing stop losses too tight can cause you to exit trades prematurely due to typical price spikes. Aim to set stop losses beyond usual price noise, but close enough that significant adverse moves are cut off early. For example, if the market tends to fluctuate by 10 points during a session, setting your stop loss 15 to 20 points away might prevent getting stopped out by normal ups and downs.
Proper placement depends on the asset’s volatility and your trading timeframe. A good trick is to use recent swing lows or highs as a reference. This offers a natural cushion rather than an arbitrary number. Always avoid moving your stop loss further after entering a trade unless you have a strong reason, as this can increase your risk quietly.
Profit targets should reflect achievable returns based on market behaviour, not greed. Overambitious targets often lead to missed exits and holding onto trades too long, risking reversals. For boom and crash trading, monitor typical trend lengths — say, if upswings average 30 points, your profit target could be set near that range.
Setting a realistic target helps secure gains and maintains consistent profitability. Use risk-reward ratios, such as aiming for profits double your risk, but adjust for market conditions. A 1:2 risk-to-reward ratio often suits volatile instruments well, preventing impatience and overtrading.
Deciding your trade size requires balancing your total capital against potential risk per trade. A common rule is to risk no more than 1-2% of your trading capital on one position. For instance, if your account stands at R20,000, risking R400 (2%) per trade helps preserve your funds even if several trades go against you.
Calculating position size involves your stop loss distance and risk amount. Larger stop loss distances mean smaller trade sizes to keep risk constant. This approach helps you stay in the game longer, avoiding rapid depletion from a few poor trades.
Boom and crash markets can spike sharply with little warning. Trading large positions without regard to this volatility risks blowing your entire account overnight. Overexposure happens when traders let emotions push them into bigger-than-planned trades, often following a string of wins.
To avoid this, set clear maximum position sizes and stick to them. Also, avoid opening multiple simultaneous trades if your total exposure chances exceed a reasonable portion of your funding—capping exposure at no more than 10-15% of your capital at any time is a prudent move. This way, one bad market swing won't cause catastrophic losses.
Effective risk management isn't just a safety net—it’s what keeps you trading tomorrow after setbacks today. In boom and crash, the market’s temperament demands careful planning and self-discipline more than ever.
Managing risk well means you can approach boom and crash trading with confidence, enabling steadier growth rather than gambling on luck.
Strategy PDFs serve as valuable guides for traders looking to sharpen their approach to boom and crash indices. These documents distil trading plans into bite-sized, easy-to-reference formats that help traders stay focussed during volatile sessions. Whether you're tinkering with a trend-following method or testing a reversal strategy, having clear steps and examples mapped out in a PDF cuts down on guesswork.
A well-designed strategy PDF acts like a coach in your trading corner. It breaks down complex techniques into manageable chunks with clear instructions and charts. This helps traders, especially those still gaining confidence, to understand why and when to enter or exit trades. For instance, a PDF might outline a set-up using moving averages on boom indices and back it up with screenshots of past price action. Referencing this during live trading can reinforce discipline and reduce emotional decisions.
Beyond learning, these PDFs become practical tools for execution. They often include clear entry criteria, stop-loss levels, and take-profit targets tailored to boom and crash movements. This concise format means you can quickly double-check what's next without scrolling through lengthy notes. It’s like having a quick-access manual during fast-moving sessions.
A high-quality strategy PDF will have a few key features: first, clarity with straightforward language; second, precise chart examples relevant to boom and crash behaviours; third, well-explained risk management rules customised for volatile indices. Avoid PDFs that oversell vague promises or rely solely on complicated jargon.
Moreover, look for PDFs that include notes on adapting the strategy under different market conditions, such as periods of increased volatility (which boom and crash markets often experience). For example, a good PDF will advise you when to tighten stops during heightened volatility or when to pause trading altogether.
Even the best strategies aren’t one-size-fits-all. You’ll get the most from a PDF by tailoring its guidance to your own trading style and risk appetite. For example, if the strategy prescribes a fixed stop-loss distance that feels too tight given your usual trade management, adjust it slightly. The same goes for trading frequency—some strategies might suggest daily trades, but you may prefer to focus on setups during South African market hours or when you’re alert.
It helps to keep a trading journal alongside so you can track how your adaptations perform and tweak accordingly. This patient adjustment phase is vital before fully committing to any rigid rule set from a PDF.
A common mistake is to follow PDF strategies blindly without considering changing market dynamics or personal limits. Boom and crash indices can swing quickly, and sticking to static rules during sudden volatility spikes can lead to unplanned losses. Another trap is ignoring the local trading environment—like how Eskom loadshedding might disrupt your routine or attention.
Some traders also fail to update their PDFs or supplement them with fresh market insights, which causes them to rely on outdated methods. And then there’s over-reliance on indicators prescribed in a PDF without understanding why they work, which can lead to confusion when signals contradict each other.
Keep in mind: a strategy PDF is a map, not a mandate. It’s meant to guide, not constrain your judgement.
By embracing flexibility and critical thinking, you can breathe life into these strategy PDFs and turn them into tools that enhance your trading rather than limit it.
Understanding the typical pitfalls in boom and crash trading is vital for improving your performance. These mistakes often stem from emotional reactions and misreading market signals, which can easily erode your profits or inflate your losses. This section shines a light on the most frequent errors traders make and offers practical ways to steer clear of them, saving you time, effort, and capital.
Recognising fear and greed is a fundamental step in controlling your trading behaviour. Fear often creeps in after a few losses or during volatile market swings, tempting you to exit trades prematurely or avoid opportunities. Greed, on the other hand, pushes traders to chase unrealistic profits or double down on risky positions. For example, chasing a big win with a highly leveraged position after a good run can quickly wipe out gains if the market turns. Being aware of these emotional responses helps you pause and reassess instead of reacting impulsively.
Maintaining discipline during market swings is equally crucial. Boom and crash indices are notorious for sudden jumps and drops, which can provoke knee-jerk decisions. Sticking to a well-defined trading plan with clear entry and exit points helps combat this. For instance, setting strict stop loss levels prevents you from holding onto losing trades in the hope of a rebound. Discipline also means avoiding revenge trading — don’t try to make back losses in one go. Keeping calm and following your strategy, especially during sharp price moves, ensures steadier results.
Knowing when to step back is key to maintaining focus and avoiding burnout. Overtrading happens when you chase the market every second, often entering subpar trades just to feel active. This behaviour can drain your trading account fast and cloud your judgement. It’s better to wait for clear setups that fit your strategy than to force trades. Taking breaks during unconvincing market phases refreshes your perspective and improves decision-making.
Reading indicators correctly is essential to using technical analysis well. Boom and crash markets behave differently from traditional markets, so standard signals may not always apply the same way. For example, a Relative Strength Index (RSI) indicating overbought conditions may stay like that longer in a boom market before a reversal happens. Relying blindly on any single indicator without confirming with price action or other tools often misleads traders. Use a combination of indicators and focus on the bigger context to make smarter calls.
Remember, trading is as much about discipline and understanding yourself as it is about reading the charts. Avoid these common mistakes to improve your chances of consistent success in boom and crash trading.
📈 Explore trading basics, market types, tools, strategies, risk control & psychology focused for South African traders to boost confidence and skills.

Explore synthetics trading in South Africa 🇿🇦 – learn how synthetic assets work, benefits, risks, platforms, regulation, and practical tips for traders.

📈 Discover smart tactics for trading synthetic indices with detailed strategies, risk management tips, and analysis methods to boost your trading skills.

🔍 Explore P2P trading in South Africa: learn how to trade safely, discover trusted platforms & understand local regulations to make informed decisions.
Based on 9 reviews